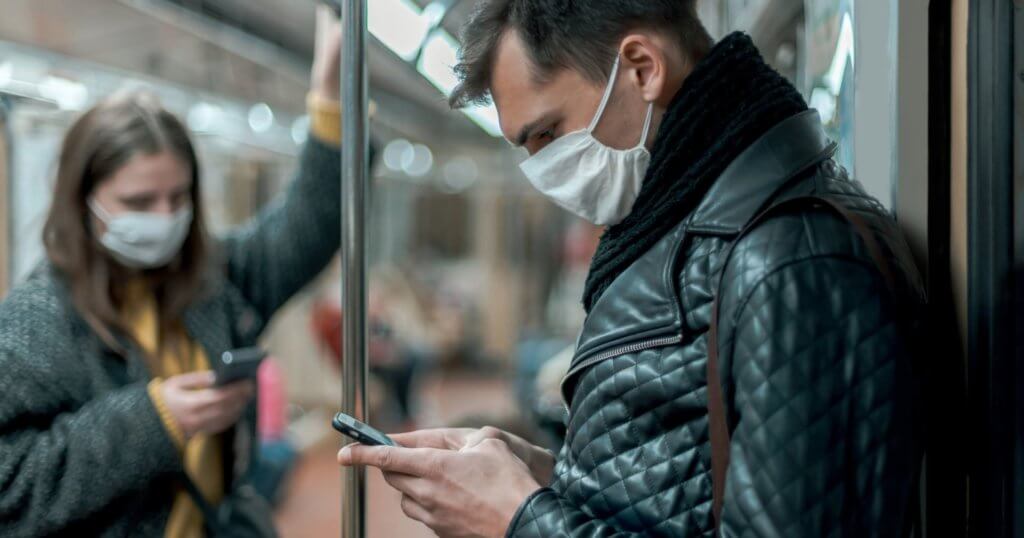
Social distancing is expected to remain a part of our lives throughout 2020 and as such, cities rely on technology including cellular data to help monitor the effects of local gathering restrictions.
To facilitate knowledge sharing — specifically about COVID-19 — between city leaders, Dr. David S. Ricketts, Innovation Fellow at Harvard TECH, hosts a weekly Zoom call to discuss the challenges cities are facing and how they are being addressed.
This week, our guests included Mobi, a mobility open blockchain initiative led by ex-NYC CIO Samir Saini that processes telco data. It was originally designed to understand mobility in cities for traffic and congestion. This technology has now been adapted to understand the movement of people during periods of restricted movement.
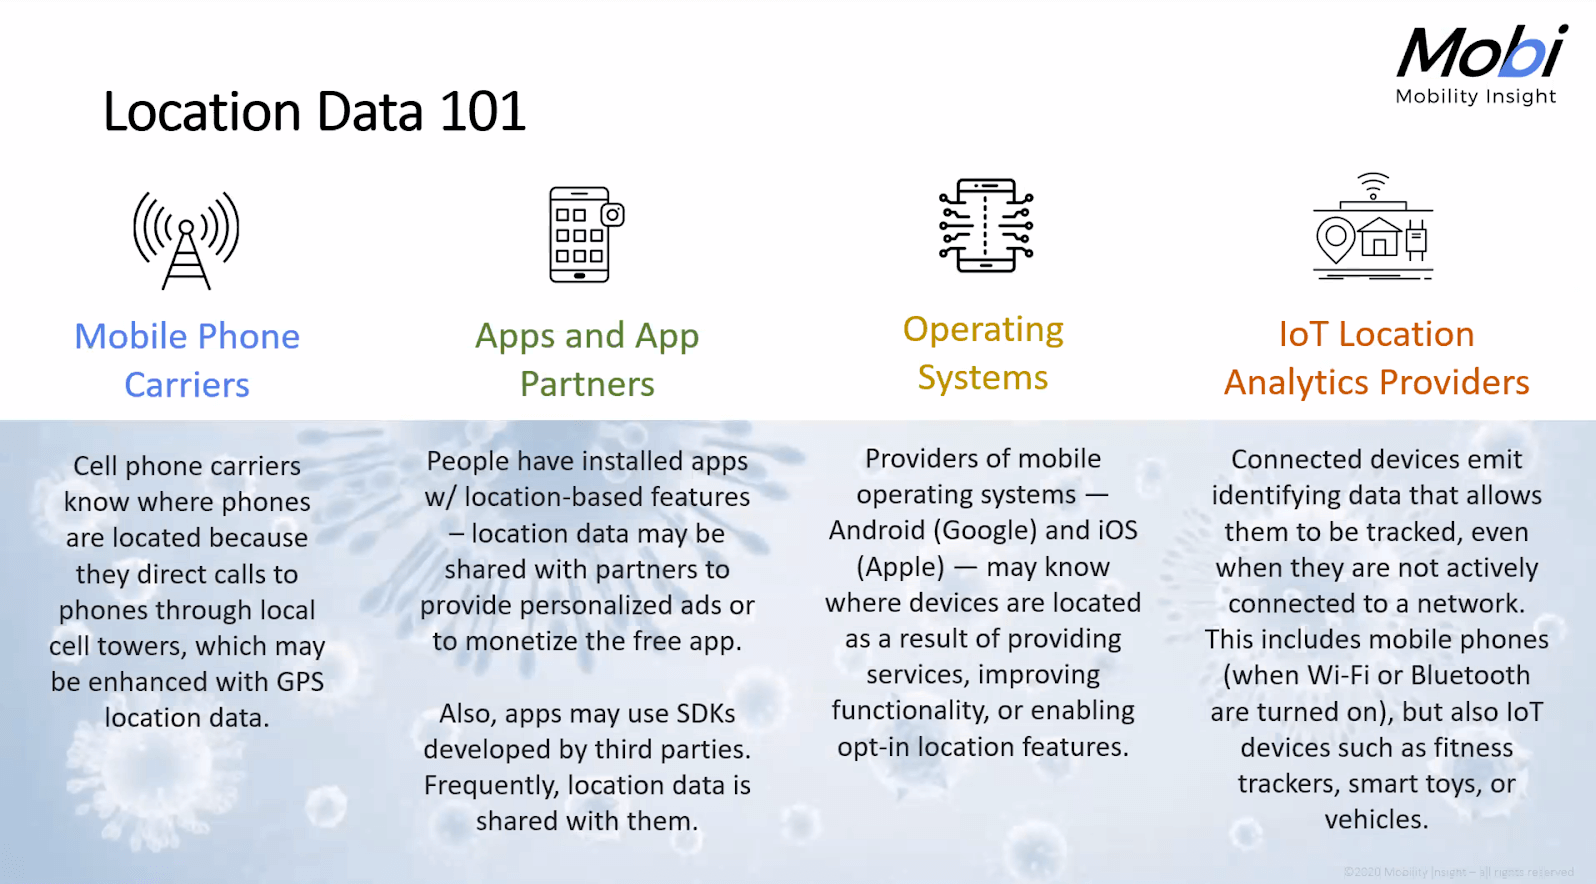
Mobi analyzes a location using telco/cellular, apps/SDKs, operating systems e.g. iOS, and over the Internet of Things or WiFi. Because the dataset being used is telco data, a large portion of the population is captured, allowing cities to better understand the macro movements of residents in a city.
Mobi uses three indexes they have developed: Total Count Ratio, Stay At Home Ratio, and Mobility Index to analyze the impact of restrictions on a city or country over time.
Trend, Track, De-densify
Public safety agencies across the globe use a cycle called “Trend, Track, De-densify.” The goal of this cycle is to:
- Identify where most people are taking the most trips and not staying at home
- Assess daily people movement trends including trip counts, total distance and total travel time
- Analyze daily/hourly people movement trends between any origin and any destination
- Receive real-time crowd alerts when large crowds are forming in a geographic area
This technology solution is already being used in Israel and has become available to cities in the U.S.
Case Study: Tracking Restriction Effectiveness in Israel
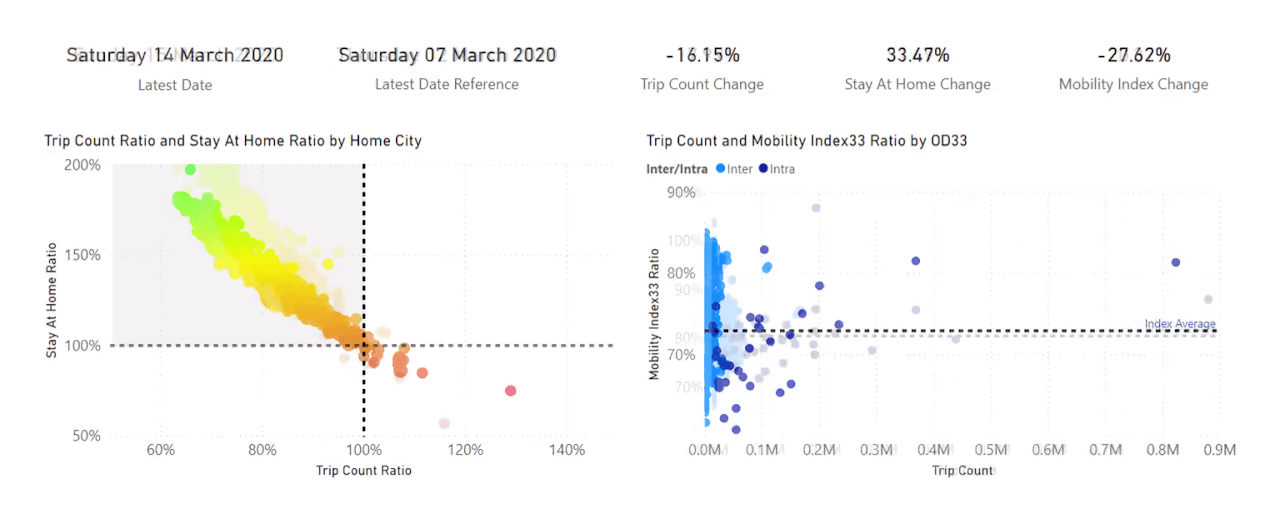
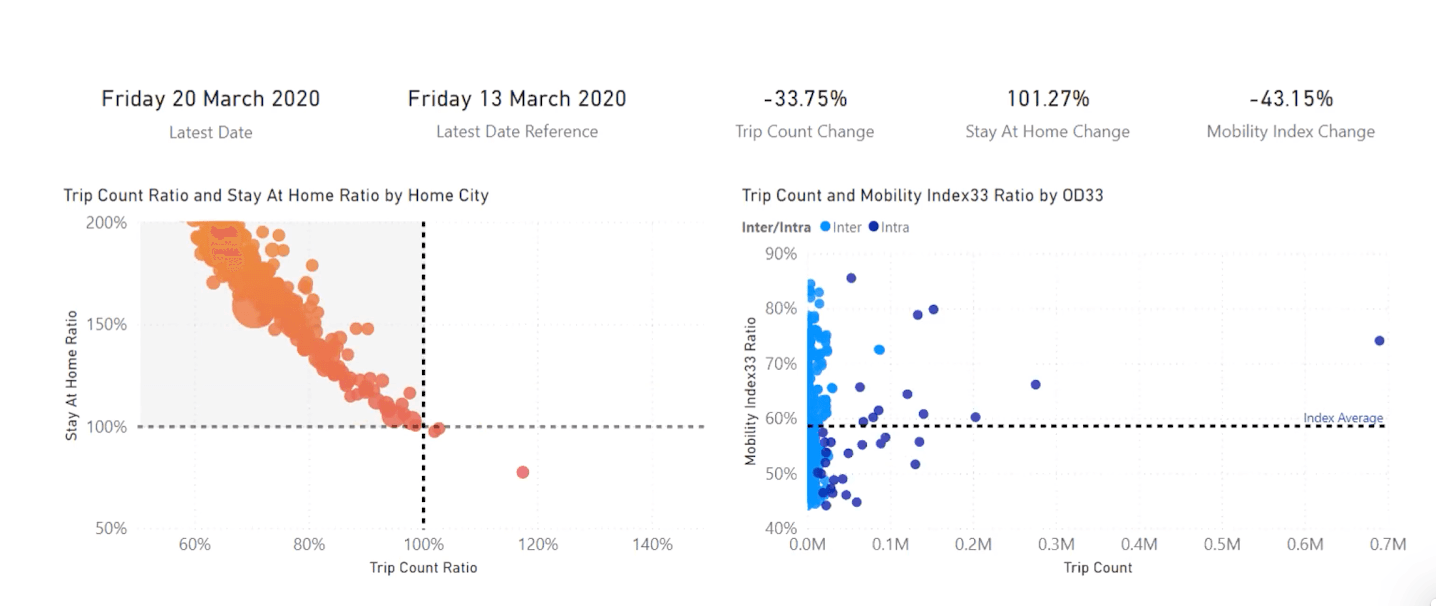
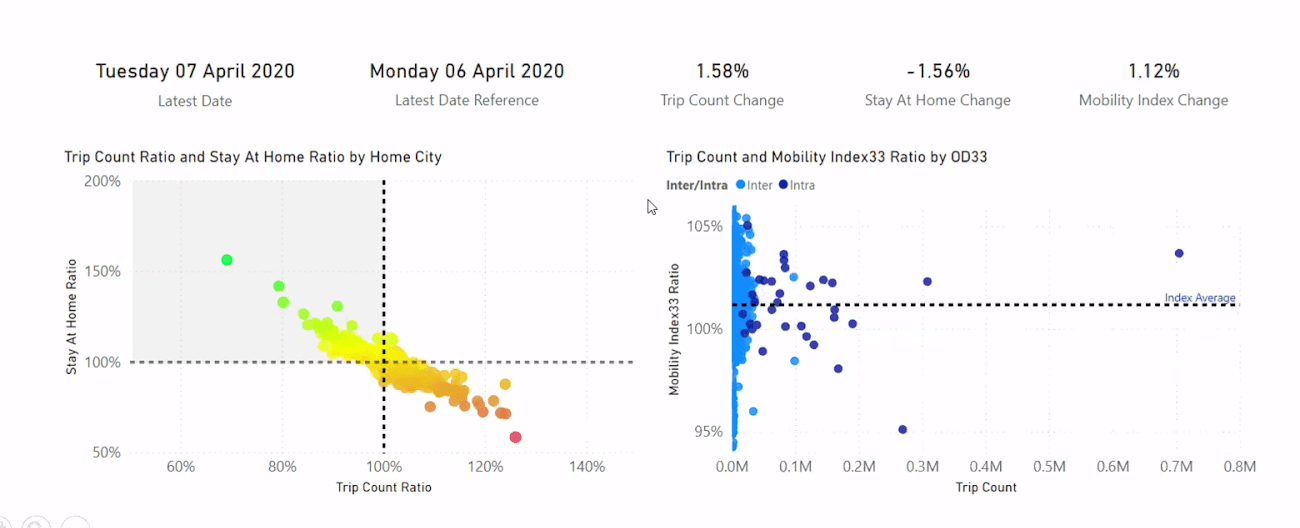
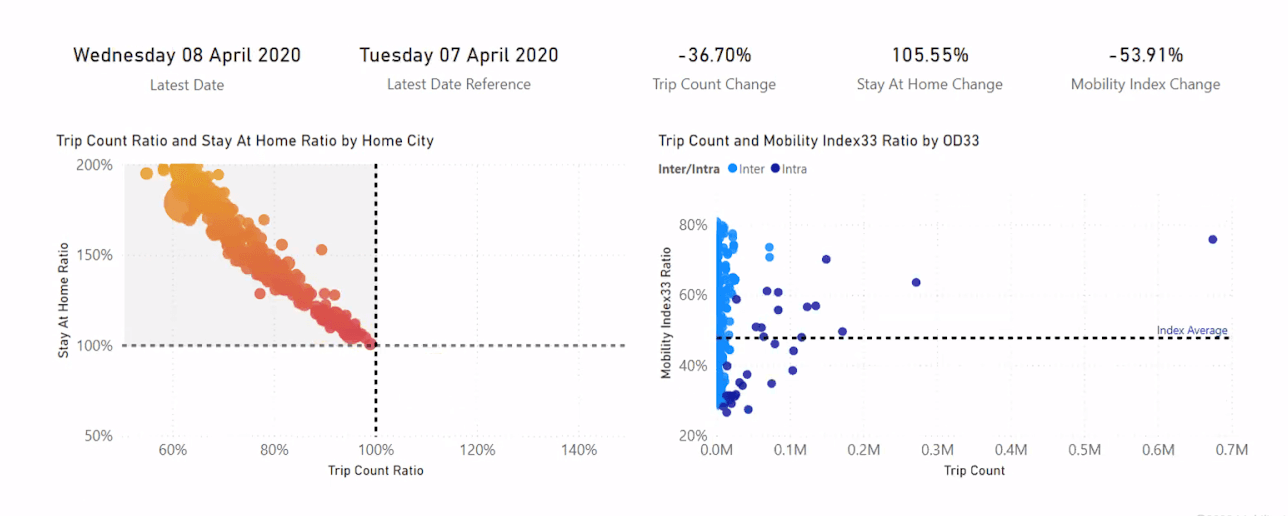
Below are five phases of lockdown in Israel and the movement of citizens analysed using mobile data. Each dot represents one city and the average movement of people within. This data is tracked over time and cross-reference against social movement restriction initiatives to measure effectiveness.
1 – Restrictions on returning air travelers and mass events
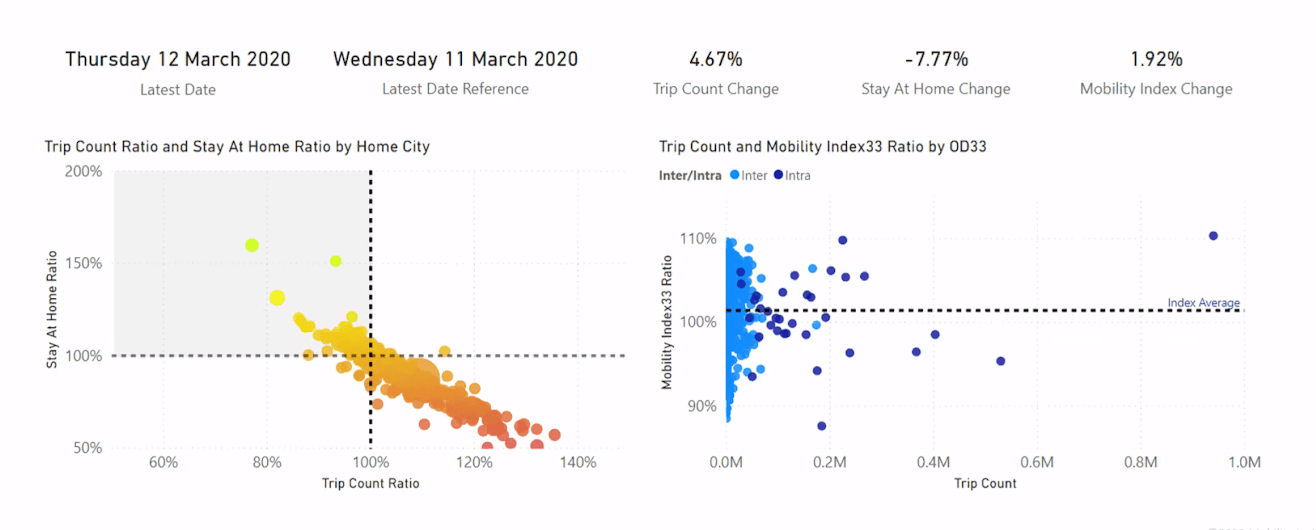
In this first example, the city’s efforts are deemed not effective enough, measuring a large trip count and a high mobility index.
2 – School and Entertainment Venue Closures
Ordering the closure of schools and entertainment venues yielded better results, as shown by a high stay-at-home ratio, low trip count ratio, and low mobility index.
3 – Stay at home directive
Enacting stricter restrictions on citizen movement resulted in a very high stay-at-home ratio, very low trip count ratio, and very low mobility index – much better!
4 – Limited lockdowns and increased enforcement – Red Flag
Here we have a case of a public safety initiative that did not yield the desired results. Limited lockdowns and increased enforcement actually resulted in more movement than before throughout the city.
5 – Imposing statewide curfew during Passover Holiday and release
Movement decreased again over the holiday as a statewide curfew went into effect.
Learn more:
Mobi provides fascinating insights for cities that want to monitor hotspots for people congregating and better understand the movement of people in their city.
You can watch the full recording of the webinar at this link.